
Sounds like Kodachome wants to be the first in the Soylent Green line.............Kodachrome-Burning wrote: There has been a human population explosion of such an enormous scale that if one compares our planet to a single living creature, then humanity's unbridled growth and placement on this living creature very closely resembles a person contracting a rare but swift terminal disease. This has been apparent to me since I was very young, probably around age 6, it is a natural instinct I have had not unlike what an animal feels about it's habitat. It has both a blessing and burden been, probably born of my indian roots....
Global Cooling
-
thisisthatwhichis

- Posts: 3586
- Joined: Thu Feb 09, 2006 6:18 pm
- Location: Reno, NV
TITWI
To be on the wire is life. The rest is waiting.
It's show time, folks.....Joe Gideon
To be on the wire is life. The rest is waiting.
It's show time, folks.....Joe Gideon
-
unjonharley

- Posts: 10434
- Joined: Tue Sep 09, 2003 11:05 am
- Burning Since: 2001
- Camp Name: Elliot's naked bycycel repair
- Location: Salem Or.
-
can't sit still
- Posts: 4645
- Joined: Tue Aug 23, 2005 4:21 pm
- Location: SoCal
I have to agree with Isotopia. I prefer to follow the truth ,where ever it leads. The undeniable truth is that, in our present epoch, the ice WILL return. We're just in a nice interglacial period,,, the late Holocene. We've recently set a whole bunch of new records for cooling.
Man has been through 2 ice ages before. He had more hair back then. Mother Nature has taken a good licking several times. This ball of rock will continue,,, though it gets frosted and toasted from time to time. When a meteor caused the Chicxulub crater, 65 miles in diameter, it supposedly raised the air temp worldwide to 450 F
http://www.google.com/url?q=http://en.w ... y5UEgG7IRw
When the 300 mile wide Vredefort crater was formed, I imagine that it got even warmer.
There is no doubt that we're in climate change. I believe that it is a complete waste of time to try to adjust CO2. It was proven a long time ago that CO2 isn't the problem. Why doesn't Gore try to change the # 1 greenhouse gas,,, water vapor. He also need to stop cow farts and volcanoes.
I don't post things because I believe that they are the absolute truth. I post them because I believe that they should be considered.
-
Kodachrome-Burning

- Posts: 25
- Joined: Mon Nov 23, 2009 12:32 am
- Location: Colorado
- Contact:
I agree that it is a waste of time to adjust CO2 as well, we are about 50 years too late....can't sit still wrote:I believe that it is a complete waste of time to try to adjust CO2. It was proven a long time ago that CO2 isn't the problem. Why doesn't Gore try to change the # 1 greenhouse gas,,, water vapor. He also need to stop cow farts and volcanoes.
When you say a long time ago, you mean a span of time less than 100 years, right? Dinosaurs were on the planet 160 million years ago, so 100 years is .000000625 of the time span between now and the time those dinosaurs roamed. And that 160 million years ago is .04 the estimated duration of time that the Earth has been in existence.
Let me put this in perspective, a relative of mine is the former manager of Radiation and nuclear safety for a big aerospace company, a scientist's scientist, we have talked about humanity's resistance to seeing the big picture for years now:
If you take 160 million years, which is a .04 the lifespan of the earth and compress it into the only time frame humans seem to relate to, 75 years, then the human population has more than doubled in a mere 73 seconds on the surface of the planet. The amount of change that has occurred in those 73 Earth seconds ( 50 years ) is staggering when looking at the total scale.
So this ensues what I refer to as the "Delayed Consequence" effect in which we are totally oblivious to what the true effects of our human detonation really are. We think we know so much, but we don't and it shows...we think in terms of our life spans and not the other time frames, we are truly ignorant of the consequence.
I don't need the World at my fingertips - it's planted firmly beneath my feet
-
dr.placebo

- Posts: 980
- Joined: Mon Sep 13, 2004 3:03 pm
- Burning Since: 1999
- Camp Name: Cleu Camp
- Location: Volcano, HI
- Contact:
I think that the climate change model is basically correct. That does not mean that I excuse cooking the data to fit the models - far from it.
I agree that we are in an interglacial, which means that we are an average of 8-10 degrees C warmer than 20k years ago. We know very little about the future of this interglacial, since the shape of the curves varies a lot for different interglacials.
http://en.wikipedia.org/wiki/Interglacial
It is critical to look at the correct time scale, though. The current climate models indicate that a very rapid rise in CO2 levels, primarily from human activity, is causing a high rate of temperature change. The data do not support global cooling.
What worries me is that we have sufficiently perturbed the CO2 balance that the change is going to be quite sudden with respect to the "normal" operation of the climate cycles. Combined with our other lack of consideration for consequences (mostly tied to overpopulation) neither we nor the other species on this planet may be able to track the changes without severe disruption.
I'd like to see us all come in for a "soft landing", but I'm not at all confident that it is going to happen. The likelihood of the landing being soft decreases when we deny that it is going to happen.
-
ygmir

- Posts: 30403
- Joined: Thu Sep 20, 2007 8:36 pm
- Burning Since: 2007
- Camp Name: qqqq
- Location: nevada county
with all that guilt, doom, and gloom, interfacing with the incrimination and accusations, as well as blame and self (humans) loathing......
you sure you want to participate in an event that burns shit, runs hundreds of generators and mutant vehicles, just for pleasure, and, has no real collective concern for air pollution or carbon footprint?
as for me, and, I hope you can join me:
[youtube][/youtube][youtube][/youtube]
you sure you want to participate in an event that burns shit, runs hundreds of generators and mutant vehicles, just for pleasure, and, has no real collective concern for air pollution or carbon footprint?
as for me, and, I hope you can join me:
[youtube][/youtube][youtube][/youtube]
YGMIR
Unabashed Nordic
Pagan
Unabashed Nordic
Pagan
-
Kodachrome-Burning
- Posts: 25
- Joined: Mon Nov 23, 2009 12:32 am
- Location: Colorado
- Contact:
-
can't sit still
- Posts: 4645
- Joined: Tue Aug 23, 2005 4:21 pm
- Location: SoCal
"Long time ago" Somewhere on this thread, i posted a link to an experiment within the last 100 years. If I remember correctly, a guy built 2 greenhouses; 1 out of rock salt ,, one out of glass,, maybe quartz. The glass passes infrared and the rock salt doesn't. Sorry, I can't remember the details.
I've studied geology so I try to have an extended time sense. I won't argue about man's "explosion" We try to turn the whole globe into our ecological niche. Mother Nature HATES a mono culture.
A lot of people dismiss the 2012 alignment as a bunch of hooey like Y2K. From extensive reading of Jennifer Lawson, NASA and other sources, I don't believe that the 2012 event is going to be a no-show like Y2K.
Then, there is the man-made weather modifications as warfare;
http://www.globalresearch.ca/index.php? ... va&aid=319
It's impossible to know how much of our weather is natural.
We just had record snow fall in China also,,,
" Unprecedented in hurricane history in the Caribbean"
"The first-ever hurricane formed in the South Atlantic"
"Japan has suffered its highest number of typhoon strikes on record,"
"562 tornadoes hit the United States, the highest in recorded history, far exceeding the previous monthly peak of 399 in June 1992"
""Switzerland experienced its hottest June [2003] in at least 250 years"
I believe that the next several years are going to be a wild ride,,, with a lot of crop destruction.
We'll be forced to eat playa snakes and jackalopes.
I don't post things because I believe that they are the absolute truth. I post them because I believe that they should be considered.
-
dr.placebo
- Posts: 980
- Joined: Mon Sep 13, 2004 3:03 pm
- Burning Since: 1999
- Camp Name: Cleu Camp
- Location: Volcano, HI
- Contact:
Yes, I'm quite sure!ygmir wrote:you sure you want to participate in an event that burns shit, runs hundreds of generators and mutant vehicles, just for pleasure, and, has no real collective concern for air pollution or carbon footprint?
If I was inclined to self-sacrifice to reduce my global impact I'd be dead already. Calling for self-sacrifice (total or partial) from a segment of the population is unlikely to be productive.
BTW, Y2K was not a no-show. I have photographic evidence that the year 2000 actually occurred, as did the years 2001 through 2009. I expect that 2012 will occur, as will 2013 and at least a few after that.
-
geekster

- Posts: 4865
- Joined: Wed Sep 08, 2004 2:53 pm
- Location: Hospice For The Terminally Breathing
- Contact:
The emails are one thing. What is in the "documents" directory of the zip file is another. If you want a copy, I have it but it is available on the net, probably a torrent by now.On the subject of the cited article I'm not sure how much has been taken out of context. What I do know is that if science has been manipulated in any way to drive an agenda then that's bullshit. It's criminal and unconscionable.
In particular HARRY_READ_ME.txt which you can google by now as others have discovered it. It reads like a programmers version of a Stephen King novel:
mv HARRY_READ_ME.txt MISERY might be the appropriate command. Here the data is tortured six ways to Sunday to get it to FINALLY fit the model.
One can not ridicule a "skeptic" for not publishing in peer-reviewed literature while at the same time engaged in active management of the processes to ensure that they do not get published or stacking the deck of reviewers to ensure an outcome or intimidating the publisher by threatening to never submit an article to them again.
The process needs to be changed so that this can't happen again. Journals need to publish electronically and asynchronously. With electronic publishing on the Internet, they can publish articles daily, not in periodical "issues".
But this is really fucking funny:
http://iowahawk.typepad.com/iowahawk/20 ... chers.html
Pabst Blue Ribbon - The beer that made Gerlach famous.
-
geekster
- Posts: 4865
- Joined: Wed Sep 08, 2004 2:53 pm
- Location: Hospice For The Terminally Breathing
- Contact:
"I think that the climate change model is basically correct."
Climate ALWAYS changes. It oscillates at various amplitudes at various times, but it is always changing. People simply do not appreciate that the Little Ice Age that ended in the 1800's was the COLDEST time of the current interglacial since the Younger Dryas, some 12,000 years ago.
So look at it this way:
The modern thermometer was invented in the 1700's. In the 1700's we were in the coldest period for the last 12,000 years. All temperatures recorded since the widespread deployment of the thermometer show warming temperatures as the climate recovered from that event. We fully "recovered" in 1933 which was warmer than the current warm spell. Superimposed on that is an approximately 60 year cycle having to do with the Pacific Ocean (ENSO and the PDO). So after about 1945 we went PDO negative for 30 years until about 1976 when we went PDO positive and had warming. We had a "super el nino" event in 1989. The climate "scientists" seized on that and projected 1989 warming to continue into the future. It didn't happen.
Do this: Go to http://www.ncdc.noaa.gov/oa/climate/res ... g3/na.html
In the scroll list for "period" go all the way to the bottom and select "most recent 12-month period". For first year to display, select 1998 then click "Submit". You will see that over the past 12 years there has been cooling at a rate of 0.9F per decade or nearly 9 degrees per century. That is a HUGE amount of cooling. At that rate we would be in another ice age before the end of this century. It won't continue at that rate, or at least I hope it doesn't because if it does we will all starve and Canada will be moving to the US ... on the front of a glacier.
The point is that climate ALWAYS changes. And there isn't a damned thing you or I or Oregon are going to do about it in any way that is measurable.
Pabst Blue Ribbon - The beer that made Gerlach famous.
-
geekster
- Posts: 4865
- Joined: Wed Sep 08, 2004 2:53 pm
- Location: Hospice For The Terminally Breathing
- Contact:
"The undeniable truth is that, in our present epoch, the ice WILL return."
Glaciation is the normal state over at least the past 2 million years. We spend 90% of the time in glacial conditions and 10% of the time in interglacial warm periods. We are nearing the end of this interglacial warm period. Modern humans have survived two glacial periods but that was before we migrated North of Africa. The next glaciation will be catastrophic to our current culture. Canada and Russia will be uninhabitable as will a large portion of North America that produces most of the world's food.
We have much more to fear from cooling than from warming.
Pabst Blue Ribbon - The beer that made Gerlach famous.
-
dr.placebo
- Posts: 980
- Joined: Mon Sep 13, 2004 3:03 pm
- Burning Since: 1999
- Camp Name: Cleu Camp
- Location: Volcano, HI
- Contact:
And if I do the same thing, but start 10 years earlier I get a warming trend of 0.39 degrees F per decade. Why should I use the shorter period?geekster wrote:Do this: Go to http://www.ncdc.noaa.gov/oa/climate/res ... g3/na.html
In the scroll list for "period" go all the way to the bottom and select "most recent 12-month period". For first year to display, select 1998 then click "Submit". You will see that over the past 12 years there has been cooling at a rate of 0.9F per decade or nearly 9 degrees per century. That is a HUGE amount of cooling. At that rate we would be in another ice age before the end of this century. It won't continue at that rate, or at least I hope it doesn't because if it does we will all starve and Canada will be moving to the US ... on the front of a glacier.
BTW, it's called "global warming", not "U.S. warming". For October 2009 we get the following snapshot:

which shows that the U.S. was unusually cold compared to the rest of the world. A longer term global trend is shown by:

Data and images come from the Goddard Institute for Space Studies (GISS).
-
ygmir
- Posts: 30403
- Joined: Thu Sep 20, 2007 8:36 pm
- Burning Since: 2007
- Camp Name: qqqq
- Location: nevada county
Is this really the poster boy for global warming?

and, if so, perhaps, this is why some folks don't take the info so serious........
http://www.associatedcontent.com/articl ... html?cat=9
and, if so, perhaps, this is why some folks don't take the info so serious........
http://www.associatedcontent.com/articl ... html?cat=9
YGMIR
Unabashed Nordic
Pagan
Unabashed Nordic
Pagan
-
dr.placebo
- Posts: 980
- Joined: Mon Sep 13, 2004 3:03 pm
- Burning Since: 1999
- Camp Name: Cleu Camp
- Location: Volcano, HI
- Contact:
I don't especially like Al Gore. He is basically a politician, and I think that I would find it unpleasant to have dinner with him. Most of the time he gets his concepts and facts reasonably correct, though. My guess is that he meant "thousands" and it came out "millions." He should have corrected it, but did not. Not his most endearing trait.
More important, though, is that whether Al Gore is a sinner or a saint is irrelevant to the accuracy of the global warming scenario. I've been swayed more by the graphs that I've seen than any words by any politicians.
More important, though, is that whether Al Gore is a sinner or a saint is irrelevant to the accuracy of the global warming scenario. I've been swayed more by the graphs that I've seen than any words by any politicians.
-
geekster
- Posts: 4865
- Joined: Wed Sep 08, 2004 2:53 pm
- Location: Hospice For The Terminally Breathing
- Contact:
Because the longer 20 year trend includes the PDO cyclical warming that ended around 2001. The shorter trend shows what has been happening over the past 12 years ... rapid cooling.Why should I use the shorter period?
And yes it is "global" warming but the US accounts for a large amount of the land mass in the Western portion of the Northern Hemisphere, it is a fairly good sample of temperature over roughly 25% of the globe.
The GISS data has no actual measurements for polar temperature. Jim Hansen plugs in his model run temperature for polar temps. What you see as that big red anomaly in GISSTEMP maps are NOT actual observations, they are the output of their model. Additionally, literally thousands of stations have been dropped by GISS, most of them rural in South America and Africa.
So GISS also does some really odd adjustments for urbanization. I would suggest you use the satellite measurements (UAH/RSS) they use different satellites and use a different mechanism to account for time of observation but they are VERY close to each other in result. They require no UHI adjustment and measure the temperature of the lower troposphere globally.
It is no warmer today than it was in 1987 or 1991.
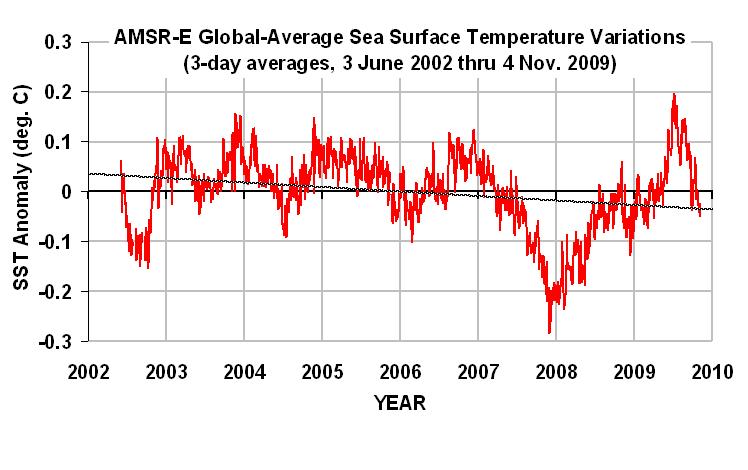
Sea surface temperatures are also not warming:
ARGO float data also show no warming at all globally since 2004.
Sea level is also not rising and has not exceeded a peak set it late 2005. It has been virtually flat for the past 4 years. Oh, and Himalayan glaciers aren't melting either.

Sea level (and temperatures) in this interglacial reached their peak about 6000 years ago (splitting the difference between 5000 and 7000) when sea levels were about 2 meters higher than today. We are seeing neither "unprecedented" temperatures nor "unprecedented" sea levels or sea level change.
It just isn't happening.
What IS happening is that you are being fed a line of "oh there is this crisis and the earth is heating up, if you elect our slate of candidates and allow us to regulate more aspects of your life, we can save you" while the places that account for most of the badness such as CO2 emissions are exempt from all that regulation. You are led to believe that you can make a difference when you can't. US CO2 emissions are actually down and there is no measurable difference in the increase in global CO2 rise because China and India are going to swamp anything anyone can do. China INCREASES their CO2 emissions by the total amount emitted by the entire country of Australia in less than 12 months. This means that if Australia were "turned off" and put back completely natural with not a human living there, in 12 months time global CO2 emissions would be right back where they are today. And there is no evidence so far that CO2 at todays level has any measurable impact on temperature.
We can live with 2 degrees warmer temperatures globally. 2 degrees colder would kill a lot of people from starvation. Cooling is much more dangerous than warming.
Pabst Blue Ribbon - The beer that made Gerlach famous.
-
geekster
- Posts: 4865
- Joined: Wed Sep 08, 2004 2:53 pm
- Location: Hospice For The Terminally Breathing
- Contact:
I was inaccurate in one thing above. China increases its emissions by the total emissions of Australia in FOUR months, not twelve.
In twelve months, China's increase is like adding three Australias to the globe. Australia wants to spend a huge amount of money and implement reams of regulations to reduce emissions by 5% over 10 years. Can you see what an idiotic proposal that is?
Here is a political ad that does give a visual that might help people "get it".
[youtube][/youtube]
"Global warming" is being used as an emotional "hook" to get people who are sincerely wanting to do the right thing to part with their hard earned cash and their freedom. People are being mislead and taken advantage of. Or more bluntly, flat out robbed.
Did you know that more CO2 is emitted by unchecked natural coal seam fires in China, India, Indonesia and the US than is produced by all the automobiles on the entire planet?
People have no idea of the sense of scale.
Pabst Blue Ribbon - The beer that made Gerlach famous.
-
dr.placebo
- Posts: 980
- Joined: Mon Sep 13, 2004 3:03 pm
- Burning Since: 1999
- Camp Name: Cleu Camp
- Location: Volcano, HI
- Contact:
Geekster, I don't see the rapid cooling in the global context or on a multi-decade scale. I've been trained to ignore short term spurious trends on noisy data, and it's for good reason.
I extended the time span for the U.S. to 50 years (1959-2009) and the trend is 0.38 degrees F warmer per decade. When I look at 1959-1969 I get a trend of 0.58 degrees F cooler per decade, which indicates that a decade is probably not the right scale for extracting trends using this data.
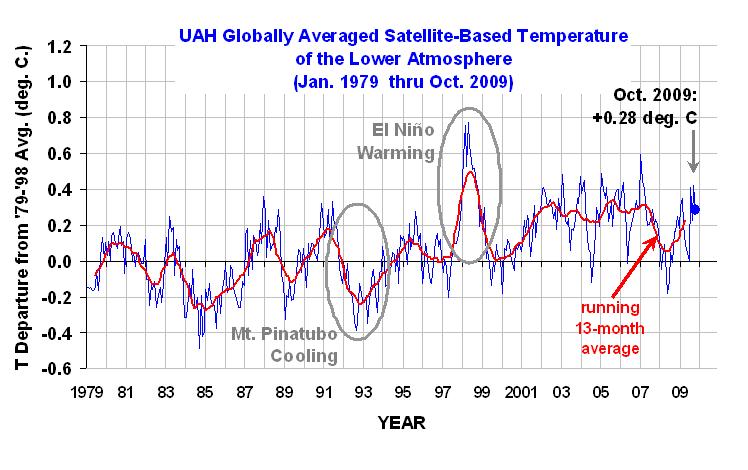
I don't understand why you threw in the first chart (globally averaged satellite temp). It looks like a warming trend to me, given that there are no negative departures in temperature (using the 13-month average) since 1994.
The trend line in your second graph (global sea temps) shows a negative trend, but the trend is dragged down by exactly one year - 2008. Short intervals over noisy data produce very noisy results.
Your average mean sea level (AMSL) graph shows a distinct upward trend even if the trend since 2002 (which was smack on the trend line) is slightly less than the trend since 1993 (possibly just noise, again).
I am under no illusion that the solution is anything but systemic and global.
For more discussion by real climatologists:
http://www.realclimate.org/index.php/ar ... ing-pause/
I extended the time span for the U.S. to 50 years (1959-2009) and the trend is 0.38 degrees F warmer per decade. When I look at 1959-1969 I get a trend of 0.58 degrees F cooler per decade, which indicates that a decade is probably not the right scale for extracting trends using this data.
I don't understand why you threw in the first chart (globally averaged satellite temp). It looks like a warming trend to me, given that there are no negative departures in temperature (using the 13-month average) since 1994.
The trend line in your second graph (global sea temps) shows a negative trend, but the trend is dragged down by exactly one year - 2008. Short intervals over noisy data produce very noisy results.
Your average mean sea level (AMSL) graph shows a distinct upward trend even if the trend since 2002 (which was smack on the trend line) is slightly less than the trend since 1993 (possibly just noise, again).
I am under no illusion that the solution is anything but systemic and global.
For more discussion by real climatologists:
http://www.realclimate.org/index.php/ar ... ing-pause/
-
dr.placebo
- Posts: 980
- Joined: Mon Sep 13, 2004 3:03 pm
- Burning Since: 1999
- Camp Name: Cleu Camp
- Location: Volcano, HI
- Contact:
I'd be interested in the cite. To my way of thinking, if coal seam fires are a significant source of CO2 then it increases our need to get rid of coal as an energy source rather than decreasing the urgency. More mining, more fires.geekster wrote:Did you know that more CO2 is emitted by unchecked natural coal seam fires in China, India, Indonesia and the US than is produced by all the automobiles on the entire planet?
I almost forgot about the glacier stuff.
http://www.grid.unep.ch/glaciers/Global Glacier Changes: facts and figures
There is mounting evidence that climate change is triggering a shrinking and thinning of many glaciers world-wide which may eventually put at risk water supplies for hundreds of millions — if not billions — of people. Data gaps exist in some vulnerable parts of the globe undermining the ability to provide precise early warning for countries and populations at risk. If the trend continues and governments fail to agree on deep and decisive emission reductions at the crucial UN climate convention meeting in Copenhagen in 2009, it is possible that glaciers may completely disappear from many mountain ranges in the 21st century.
-
geekster
- Posts: 4865
- Joined: Wed Sep 08, 2004 2:53 pm
- Location: Hospice For The Terminally Breathing
- Contact:
1. We have the technology right now to eliminate every coal power plant in the country and recycle nuclear fuel rather than burying it.
2. Stopping use of coal as a fuel supply will not put those coal seam fires out.
3. That IPCC comment on glaciers is pretty much propaganda made of up whole cloth and not supported by the science.
Another interesting thing is to hear Hansen and Jones complain about how the satellite temperature data is "flawed". Ok, so assume it is, say it under reports the temperature by a degree. You should still see the trend they are reporting even though it might be shifted down a degree. What we see is flat to recent decline. And so that would have to mean that there is not only an error, the error gets worse with every passing month.
Whose data would you put more faith in? Data that is collected by two completely different organizations with two different satellite platforms using two different methods of reaching their result and whose results have been in general agreement for 30 years and whose data and methods are open for all to see, or someone who comes to a completely different conclusion that refuses to let anyone look at their data and methods?
One of the most often cited examples of glaciation is Kilimanjaro. The truth is that it has nothing to do with temperature. It is due to greatly reduced precipitation caused by deforestation of the surrounding area. Trees do not aspirate moisture into the air anymore that would fall on the mountain as snow. The air is much dryer now and so there is less snow.
The recent IPCC comment about the Himalaya glaciers is a mystery and nobody can seem to find out where that comment came from because there is no evidence of it in the science. It appears to be simply made up.
No Sign Yet of Himalayan Meltdown, Indian Report Finds
Bagla
Science 13 November 2009: 924-925
No Sign Yet of Himalayan Meltdown, Indian Report Finds
Pallava Bagla
Are Himalayan glaciers beating a rapid retreat in the face of global warming? That would seem to be the case, according to a flurry of recent reports by BBC and other mass media. But the picture is more complex—and poses scientific puzzles, according to a review of satellite and ground measurements released by India's Ministry of Environment and Forests earlier this week. The report, by senior glaciologist Vijay Kumar Raina, formerly of the Geological Survey of India, seeks to correct a widely held misimpression based on measurements of a handful of glaciers: that India's 10,000 or so Himalayan glaciers are shrinking rapidly in response to climate change. That's not so, Raina says.
he “extremely provocativeâ€
Pabst Blue Ribbon - The beer that made Gerlach famous.
-
geekster
- Posts: 4865
- Joined: Wed Sep 08, 2004 2:53 pm
- Location: Hospice For The Terminally Breathing
- Contact:
"real" climate is the LAST place on earth I would go to find accurate information. If they have to add the word "real", then it probably isn't. Sort of like any website that contains the word "truth". Besides, Gavin is a known arm-waiver and he works for GISS which pretty much produces junk.real climatologists:
Pabst Blue Ribbon - The beer that made Gerlach famous.
-
geekster
- Posts: 4865
- Joined: Wed Sep 08, 2004 2:53 pm
- Location: Hospice For The Terminally Breathing
- Contact:
This time line of a very specific issue is the best encapsulation of the real problem. In addition to email on Jone's side of the issue, it includes information from the other side of the conversation as well.
It is quite long but I got it from a mailing list so I can't produce a link at the moment. It goes into the depth of the covering up of data and methods engaged in by Jones and colleagues including Gavin Schmidt. Here you see clear evidence of a concerted effort involving several people around a single FOIA request to simply obtain station data and the mechanism used to plot the temperature in order to check to see if it can be reproduced or if there is an error in the code:
[quote]Freedom of information, my okole…
by Willis Eschenbach
People seem to be missing the real issue in the CRU emails. Gavin over at realclimate keeps distracting people by saying the issue is the scientists being nasty to each other, and what Trenberth said, and the Nature “trickâ€
Pabst Blue Ribbon - The beer that made Gerlach famous.
-
dr.placebo
- Posts: 980
- Joined: Mon Sep 13, 2004 3:03 pm
- Burning Since: 1999
- Camp Name: Cleu Camp
- Location: Volcano, HI
- Contact:
As someone who has wasted a fair amount of time responding to information fishing expeditions, I'd like to point out where the discovery process (including Freedom of Information requests) can be used to hamstring people. Reluctance to respond, when one is already short of time, is not necessarily evidence of evil intent.
Personally I'd rather that the raw data was freely available if it was funded by public money. There is a risk involved where such data is misinterpreted, but I think that the risk is balanced out by the benefits of transparency.
But much of this is smokescreen. Too many have lost objectivity, and too many have lost sight of what makes the data meaningful. Too many people are concerned about very short term or very long term trends, when one ought to be examining the trends of the last 50-200 years for the anthropogenic signal. Longer than about 200 years and there is relatively little effect from fossil fuels (we can have a separate conversation and separate time scale for agriculture and deforestation), and much shorter than 50 years and we lose the signal in the noise (there are some exceptions).
Further, we have to look at multiple kinds of measurement in a global context to determine if the tends are real or artifacts. Single regions alone do not prove or disprove a global trend.
Look at just about any of the trends in climate data over the last 50-200 years and you see strong warming trends in just about every data set. This is not coincidence. It is not a conspiracy.
If you want me to consider alternatives you need to come up with multiple credible data sets over the relevant period that show no trend or a cooling trend. Local trends in space or time don't do it. Emails that indicate fallibility among a few scientists don't do it. How about it?

-
geekster
- Posts: 4865
- Joined: Wed Sep 08, 2004 2:53 pm
- Location: Hospice For The Terminally Breathing
- Contact:
Published 10 months ago:
"Since I am no longer affiliated with any organization nor receiving any funding, I can speak quite frankly….As a scientist I remain skeptical," said atmospheric scientist Dr. Joanne Simpson, the first woman in the world to receive a PhD in meteorology. Simpson, formerly of NASA, is the author of more than 190 studies and is among the most preeminent climate scientists.
According to Japanese Scientist Dr. Kiminori Itoh, an award-winning PhD environmental physical chemist and former IPCC member, global warming scaremongering is the "worst scientific scandal in the history…When people come to know what the truth is, they will feel deceived by science and scientists."
Pabst Blue Ribbon - The beer that made Gerlach famous.
-
dr.placebo
- Posts: 980
- Joined: Mon Sep 13, 2004 3:03 pm
- Burning Since: 1999
- Camp Name: Cleu Camp
- Location: Volcano, HI
- Contact:
-
geekster
- Posts: 4865
- Joined: Wed Sep 08, 2004 2:53 pm
- Location: Hospice For The Terminally Breathing
- Contact:
See, here's the thing for me: It isn't political.
It is what it is. If the global climate is warming, then it is warming. If it is cooling then it is cooling. It bothers me when I see someone who has data that says something is so and that to mitigate that thing we need to blow a bazillion bucks but you can't look at it because they don't have to time to answer pesky questions. By the time most people are in their 40's they have heard "just trust me" several times in their lives. And maybe they don't have the education to grasp it so they get a "second opinion".
So what would happen if you went to a doctor who said you had something wrong with you and said his diagnostics clearly showed that there was something wrong but fixable but the fix is very expensive and will change your life forever. So you go to another doctor who does his own diagnostics and doesn't see anything abnormal. So he asks the first doctor to see his results and the first doctor refuses. Says "nope, I can't be bothered with your harassing me for the information". He won't let anyone see your x-rays or your test results and complains that your new doctor has never written a paper on how to take x-rays so his must be faulty ... but no, he will still not share his data even though you paid for it.
THAT is the problem here. And then when someone attempts, for example, to audit the thermometers that are used to collect this climate data and discovers thermometers in the middle of asphalt parking lots next to brick walls and air conditioning units:

not once but many times and discovers that some 80% of the recording stations of a "high quality" climate monitoring network doesn't even meet its own standards for location to get an accurate measurement .... then there is something terribly wrong.
It is like finding out your first doctor was using an x-ray machine set up all wrong to get your diagnostic results. So maybe your doctor says "it doesn't matter" (which was Gavin Schmidt's actual response when it was pointed out that the data they were collecting was bad from the start and biased warm).
There were two major events that biased US stations warm. One was the change from whitewash of the old wooden thermometer screens to latex paint. (the switch is ad hoc with some people simply deciding on their own to use paint which is against the siting recommendations) Whitewash is IR reflective. Latex paint is IR transparent. This means that when they switched, the wood in the screens themselves warmed up and radiated more heat inside the Stevenson screen warming the readings. This happened gradually over many years as stations were repainted so while there is often a "step up" in the individual station records, there is no "step up" in the overall average ... it is a gradual ramp up.
Then came the transition from mechanical recording thermometers to electronic devices. This caused two problems. The first was that the machines initially shipped had a bad sensor device that produced abnormally high readings. This was discovered when a reading several degrees above the readings of surrounding mechanical stations was observed and investigated. These initial sensors were replaced but their faulty data stands in the climate data still influencing "global warming" today. The second problem was that wireless networks were not developed to the state they are now and these sensors came with only 50 feet of cable (as you can see in the photograph above). So the sensor had to be located within 50 feet of power and the computer that collected the data. This means that stations where a Stevenson screen was located in a place that met siting standards was replaced with a station that often violated every single published criteria there is. As a result, there was more "warming" in the record while rural stations still using Stevenson screens, mechanical thermometers, and whitewash show no increase such increase.
Garbage in, garbage out. But Gavin says "it doesn't matter", we "adjust" for that. Ok, fine, show your adjustment method. "nope".
So if you go back and audit the sites, select sites in rural areas (not affected by urbanization such as blacktop, concrete, etc) that meet siting requirements ... wow! ... their data looks just like the satellite measured data.
Ok, so now the satellite data. There are two sets; UAH and RSS. UAH uses a satellite in polar orbit whose orbit is "maintained". What that means is that as the satellite makes a pass over each location twice a day (once in daylight and once at night), it passed over each target at exactly the same time each day. Its orbit is not allowed to "drift". RSS uses a satellite that drifts so the time it takes its measurement changes over time. So while it might pass over BRC at 10am, next month it might be passing over at 10:15am and the data is compared to surface measurements and a mechanism to adjust for time of observation (TO) is applied which changes as the satellite drifts. Despite this drift, the two satellite measurements are surprisingly close in both value and trend. They both tend to rise and fall together but the absolute values might be different.

Values taken from Tamino's (Grant Foster's) website.
They are pretty close and unlike anything coming out of GISS or CRU. Why? Because GISS and CRU make a lot of guesses and in the case of GISS include model output not real observations into their data set. The satellites are real measurements not only of ALL of the 30% of the Earth that is land (urban and rural) but also the 70% that is ocean. They measure the entire planet with the same instrument rather than measuring over 30% of the planet with instruments of various quality placed at random intervals with some huge gaps in coverage (South America and Africa being huge gaps in coverage). And they you apply this secret adjustment sauce to the data that you don't let anyone see and BINGO! A Completely Different Result. CRUT and GISS even differ by more than the satellites do, not only in value but often in sign. This is because they use different sauce and the secret is in the sauce.
One thing I don't like is a quack. And when a quack goes to great lengths to hide things and claim that simply wanting to see them is "harassment", then it is grounds for me to dismiss their "work".
This can be cleared up very easily. Open up the code and the data to scrutiny. The data is what it is. Where did it come from and what did you do with it. That is all people want to know. It is a very reasonable request if we are going to base policy on those results.
Now Gavin is making a pretty good PR effort over at RC but is still deflecting attention from the core issue: When will the data and methods be opened to scrutiny? They play a very interesting game of claiming "peer review" of their papers but go to great lengths to avoid "peer review" of their data and methods unless A: they pick who are "peers" and B: the data and methods remain secret.
It isn't science. It is "science".
It is what it is. If the global climate is warming, then it is warming. If it is cooling then it is cooling. It bothers me when I see someone who has data that says something is so and that to mitigate that thing we need to blow a bazillion bucks but you can't look at it because they don't have to time to answer pesky questions. By the time most people are in their 40's they have heard "just trust me" several times in their lives. And maybe they don't have the education to grasp it so they get a "second opinion".
So what would happen if you went to a doctor who said you had something wrong with you and said his diagnostics clearly showed that there was something wrong but fixable but the fix is very expensive and will change your life forever. So you go to another doctor who does his own diagnostics and doesn't see anything abnormal. So he asks the first doctor to see his results and the first doctor refuses. Says "nope, I can't be bothered with your harassing me for the information". He won't let anyone see your x-rays or your test results and complains that your new doctor has never written a paper on how to take x-rays so his must be faulty ... but no, he will still not share his data even though you paid for it.
THAT is the problem here. And then when someone attempts, for example, to audit the thermometers that are used to collect this climate data and discovers thermometers in the middle of asphalt parking lots next to brick walls and air conditioning units:
not once but many times and discovers that some 80% of the recording stations of a "high quality" climate monitoring network doesn't even meet its own standards for location to get an accurate measurement .... then there is something terribly wrong.
It is like finding out your first doctor was using an x-ray machine set up all wrong to get your diagnostic results. So maybe your doctor says "it doesn't matter" (which was Gavin Schmidt's actual response when it was pointed out that the data they were collecting was bad from the start and biased warm).
There were two major events that biased US stations warm. One was the change from whitewash of the old wooden thermometer screens to latex paint. (the switch is ad hoc with some people simply deciding on their own to use paint which is against the siting recommendations) Whitewash is IR reflective. Latex paint is IR transparent. This means that when they switched, the wood in the screens themselves warmed up and radiated more heat inside the Stevenson screen warming the readings. This happened gradually over many years as stations were repainted so while there is often a "step up" in the individual station records, there is no "step up" in the overall average ... it is a gradual ramp up.
Then came the transition from mechanical recording thermometers to electronic devices. This caused two problems. The first was that the machines initially shipped had a bad sensor device that produced abnormally high readings. This was discovered when a reading several degrees above the readings of surrounding mechanical stations was observed and investigated. These initial sensors were replaced but their faulty data stands in the climate data still influencing "global warming" today. The second problem was that wireless networks were not developed to the state they are now and these sensors came with only 50 feet of cable (as you can see in the photograph above). So the sensor had to be located within 50 feet of power and the computer that collected the data. This means that stations where a Stevenson screen was located in a place that met siting standards was replaced with a station that often violated every single published criteria there is. As a result, there was more "warming" in the record while rural stations still using Stevenson screens, mechanical thermometers, and whitewash show no increase such increase.
Garbage in, garbage out. But Gavin says "it doesn't matter", we "adjust" for that. Ok, fine, show your adjustment method. "nope".
So if you go back and audit the sites, select sites in rural areas (not affected by urbanization such as blacktop, concrete, etc) that meet siting requirements ... wow! ... their data looks just like the satellite measured data.
Ok, so now the satellite data. There are two sets; UAH and RSS. UAH uses a satellite in polar orbit whose orbit is "maintained". What that means is that as the satellite makes a pass over each location twice a day (once in daylight and once at night), it passed over each target at exactly the same time each day. Its orbit is not allowed to "drift". RSS uses a satellite that drifts so the time it takes its measurement changes over time. So while it might pass over BRC at 10am, next month it might be passing over at 10:15am and the data is compared to surface measurements and a mechanism to adjust for time of observation (TO) is applied which changes as the satellite drifts. Despite this drift, the two satellite measurements are surprisingly close in both value and trend. They both tend to rise and fall together but the absolute values might be different.
Values taken from Tamino's (Grant Foster's) website.
They are pretty close and unlike anything coming out of GISS or CRU. Why? Because GISS and CRU make a lot of guesses and in the case of GISS include model output not real observations into their data set. The satellites are real measurements not only of ALL of the 30% of the Earth that is land (urban and rural) but also the 70% that is ocean. They measure the entire planet with the same instrument rather than measuring over 30% of the planet with instruments of various quality placed at random intervals with some huge gaps in coverage (South America and Africa being huge gaps in coverage). And they you apply this secret adjustment sauce to the data that you don't let anyone see and BINGO! A Completely Different Result. CRUT and GISS even differ by more than the satellites do, not only in value but often in sign. This is because they use different sauce and the secret is in the sauce.
One thing I don't like is a quack. And when a quack goes to great lengths to hide things and claim that simply wanting to see them is "harassment", then it is grounds for me to dismiss their "work".
This can be cleared up very easily. Open up the code and the data to scrutiny. The data is what it is. Where did it come from and what did you do with it. That is all people want to know. It is a very reasonable request if we are going to base policy on those results.
Now Gavin is making a pretty good PR effort over at RC but is still deflecting attention from the core issue: When will the data and methods be opened to scrutiny? They play a very interesting game of claiming "peer review" of their papers but go to great lengths to avoid "peer review" of their data and methods unless A: they pick who are "peers" and B: the data and methods remain secret.
It isn't science. It is "science".
Pabst Blue Ribbon - The beer that made Gerlach famous.

-
geekster
- Posts: 4865
- Joined: Wed Sep 08, 2004 2:53 pm
- Location: Hospice For The Terminally Breathing
- Contact:
Oh, and it gets even better (or worse, depending).
Seems New Zealand's NIWA just got caught "cooking the books", too!
Apparently their raw data is freely available. When you look at the raw data, there is no statistically significant trend. Climate has been roughly flat since the 1850's.
So folks wanted to know why the "official" data showed a very clear warming trend and so they asked for the "adjustments" and the scientist in charge said (just like his UK counterparts) "nope" but his colleagues DID provide the data:
http://wattsupwiththat.com/2009/11/25/u ... icial-one/
Careful with who you let see the "adjustments", eh?
In this case they made "global warming" by adjusting the past to be colder. So the adjusted record shows significant modern warming by adjusting older temperatures down more the farther back you go in the record. If you can't make the present warmer, you can make the past colder!
If anything the adjustments should be the opposite. Modern temperatures should be adjusted downwards to compensate for heating due to urbanization that aren't due to climate change. Adjusting modern temperatures upwards exaggerates UHI (Urban Heat Island) but probably not so much in New Zealand as in other places.
Seems New Zealand's NIWA just got caught "cooking the books", too!
Apparently their raw data is freely available. When you look at the raw data, there is no statistically significant trend. Climate has been roughly flat since the 1850's.
So folks wanted to know why the "official" data showed a very clear warming trend and so they asked for the "adjustments" and the scientist in charge said (just like his UK counterparts) "nope" but his colleagues DID provide the data:
Why does NIWA’s graph show strong warming, but graphing their own raw data looks completely different? Their graph shows warming, but the actual temperature readings show none whatsoever!
Have the readings in the official NIWA graph been adjusted?
It is relatively easy to find out. We compared raw data for each station (from NIWA’s web site) with the adjusted official data, which we obtained from one of Dr Salinger’s colleagues.
Requests for this information from Dr Salinger himself over the years, by different scientists, have long gone unanswered, but now we might discover the truth.
Proof of man-made warming
What did we find? First, the station histories are unremarkable. There are no reasons for any large corrections. But we were astonished to find that strong adjustments have indeed been made.
About half the adjustments actually created a warming trend where none existed; the other half greatly exaggerated existing warming. All the adjustments increased or even created a warming trend, with only one (Dunedin) going the other way and slightly reducing the original trend.
The shocking truth is that the oldest readings have been cranked way down and later readings artificially lifted to give a false impression of warming, as documented below. There is nothing in the station histories to warrant these adjustments and to date Dr Salinger and NIWA have not revealed why they did this.
One station, Hokitika, had its early temperatures reduced by a huge 1.3°C, creating strong warming from a mild cooling, yet there’s no apparent reason for it.
We have discovered that the warming in New Zealand over the past 156 years was indeed man-made, but it had nothing to do with emissions of CO2—it was created by man-made adjustments of the temperature. It’s a disgrace.
NIWA claim their official graph reveals a rising trend of 0.92ºC per century, which means (they claim) we warmed more than the rest of the globe, for according to the IPCC, global warming over the 20th century was only about 0.6°C.
NIWA’s David Wratt has told Investigate magazine this afternoon his organization denies faking temperature data and he claims NIWA has a good explanation for adjusting the temperature data upward. Wratt says NIWA is drafting a media response for release later this afternoon which will explain why they altered the raw data.
http://wattsupwiththat.com/2009/11/25/u ... icial-one/
Careful with who you let see the "adjustments", eh?
In this case they made "global warming" by adjusting the past to be colder. So the adjusted record shows significant modern warming by adjusting older temperatures down more the farther back you go in the record. If you can't make the present warmer, you can make the past colder!
If anything the adjustments should be the opposite. Modern temperatures should be adjusted downwards to compensate for heating due to urbanization that aren't due to climate change. Adjusting modern temperatures upwards exaggerates UHI (Urban Heat Island) but probably not so much in New Zealand as in other places.
Pabst Blue Ribbon - The beer that made Gerlach famous.
-
can't sit still
- Posts: 4645
- Joined: Tue Aug 23, 2005 4:21 pm
- Location: SoCal
Here's a good article at the Daily Bell.
http://www.thedailybell.com/608/Hiding- ... oling.html
He argues that the lying and obfuscation are the worst part. There's just no transparency left. If everything is manipulated, why should we believe anything? They take the meme of war and attach it to everything. A WAR? on poverty?? We have wars everywhere,,, not to mention Czars everywhere. All systems are run at overload. Social engineering to make us crazy. We tune out on the news so they need to inculcate the young in school.
No wonder everybody is crazy. Geekster, remind me never to get in a debate with you.
I don't post things because I believe that they are the absolute truth. I post them because I believe that they should be considered.